
Google Chart Generator

PHP 5.4+ wrapper around Google Chart API based on Polymer 1.0 component <google-chart>.
Installation
Add composer.json dependency:
"require": {
    "martinsik/google-chart-generator": "^2.0.0"
}
Add bower.json dependency (Polymer 1.0):
"dependencies": {
    "google-chart": "GoogleWebComponents/google-chart#^1.0.0"
}
Eventually, install google-chart Polymer component as you want.
Charts
Right now, four chart types are supported: line, bar, column and pie charts.
The PHP wrapper is very liberal, it lets you set any Google Chart options via data or chart options. It doesn't have special methods for every possible option because there are are so many of them and it doesn't make sense to make wrappers for every single one of them.
To use any chart you have to import Polymer 1.0 element and WebComponents polyfill first:
<!-- Polyfill Web Components support for older browsers -->
<script src="/bower_components/webcomponentsjs/webcomponents.min.js"></script>

<!-- Import element -->
<link rel="import" href="/bower_components/google-chart/google-chart.html">
Line chart
Creating a line chart:
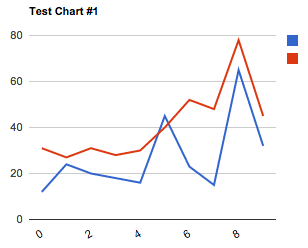
$chart = new LineChart(['title' => 'Test Chart #1']); $chart->addData(new SequenceData([12, 24, 20, 18, 16, 45, 23, 15, 65, 32], ['label' => 'Line #1'])); $chart->addData(new SequenceData([31, 27, 31, 28, 30, 40, 52, 48, 78, 45], ['label' => 'Line #2']));
Get element HTML with $chart->getElement().
<google-chart style="" type='line' options='{"title":"Test Chart #1"}' cols='[{"type":"string"},{"type":"number","label":"Line #1"},{"type":"number","label":"Line #2"}]' rows='[["0",12,31],["1",24,27],["2",20,31],["3",18,28],["4",16,30],["5",45,40],["6",23,52],["7",15,48],["8",65,78],["9",32,45]]'> </google-chart>
See all possible options for line charts.
The above code would result into this chart.
Pie chart
Creating pie chart:
$chart = new PieChart(['width' => '150px', 'height' => '150px', 'pieHole' => 0.5]); $chart->addData([new SingleData(40, 'Arc #1'), new SingleData(60, 'Arc #2'), new SingleData(80, 'Arc #3')]);
Get element HTML with $chart->getElement().
<google-chart style="width:150px;height:150px;" type='pie' options='{"pieHole":0.5}' cols='[{"type":"string","label":"Title"},{"type":"number","label":"Value"}]' rows='[["Arc #1",40],["Arc #2",60],["Arc #3",80]]'> </google-chart>
See all possible options for pie charts.
Bar chart
Creating bar chart:
$chart = new BarChart(); $chart->addData(new SequenceData([20, 40, 30]));
Get element HTML with $chart->getElement().
<google-chart style="" type='bar' options='[]' cols='[{"type":"string"},{"type":"number"}]' rows='[["0",20],["1",40],["2",30]]'> </google-chart>
See all possible options for bar charts.
Column chart
Creating column chart:
$chart = new ColumnChart(['width' => '700px', 'isStacked' => true, 'legend' => ['position' => 'none']]); $chart->addData(new SequenceData(["a1" => 20, "a2" => 40, "a3" => 30], ['label' => 'aaa'])); $chart->addData(new SequenceData(["a1" => 15, "a2" => 32, "a3" => 34], ['label' => 'bbb'])); $chart->addData(new SequenceData(["a1" => 21, "a2" => 42, "a3" => 17], ['label' => 'ccc']));
Get element HTML with $chart->getElement().
<google-chart style="width:700px;" type='bar' options='{"isStacked":true,"legend":{"position":"none"}}' cols='[{"type":"string"},{"type":"number","label":"aaa"},{"type":"number","label":"bbb"},{"type":"number","label":"ccc"}]' rows='[["a1",20,15,21],["a2",40,32,42],["a3",30,34,17]]'> </google-chart>
See all possible options for column charts.
Tests
All tests in this project are based on behat.
$ bin/behat
Then manually check generated charts in features/generated_html
License
Google Chart Generator is licensed under The MIT License.
版权声明:
1、该文章(资料)来源于互联网公开信息,我方只是对该内容做点评,所分享的下载地址为原作者公开地址。2、网站不提供资料下载,如需下载请到原作者页面进行下载。
3、本站所有内容均由合作方或网友上传,本站不对文档的完整性、权威性及其观点立场正确性做任何保证或承诺!文档内容仅供研究参考学习用!
4、如文档内容存在违规,或者侵犯商业秘密、侵犯著作权等,请点击“违规举报”。