
Magento Chrome Toolbar for MSP
Magento Chrome Toolbar is a chrome extension to be used with MSP_DevTools for Magento 1 or Magento 2.
This extension allows you to quickly access the information you need to debug your Magento performances, to build your new theme or to modify an existing one.
How can I install it?Just install from Chrome WebStore. Now you have the Chrome extension, next step is to install and configure the Magento extension.
Installing on Magento 1: Download and unzip in the Magento root: https://github.com/magespecialist/m1-MSP_DevTools/archive/master.zip. Flush your cache. Open Magento backend and go toSystem > Configuration > MageSpecialist > DevTools.
Enable devtools and set IP restrictions.
Optionally download PhpStorm Remote Call Plugin if you wish to integrate PhpStorm.
This package is also available on packagist for Magento 1 composer installation: composer require msp/devtools-m1
Installing on Magento 2: From your CLI run:Source code available on GitHub: https://github.com/magespecialist/m1-MSP_DevTools
composer require msp/devtools
Flush your cache.
Turn OFF Full Page Cache while you are using DevTools.
Upgrade database data & schema: php bin/magento setup:upgrade
Open Magento backend and go to Stores > Settings > Configuration > MageSpecialist > DevTools.
Enable devtools and set IP restrictions.
Optionally download PhpStorm Remote Call Plugin if you wish to integrate PhpStorm.
Enabling profiler feature on Magento 2:Source code available on GitHub: https://github.com/magespecialist/m2-MSP_DevTools
If you wish to enable the profiler feature, execute:
bin/magento dev:profiler:enable 'MSP\DevTools\Profiler\Driver\Standard\Output\DevTools'
Enabling SQL query feature on Magento 2:
Edit app/etc/env.php file adding the following key: $config[db][connection][default][profiler] = 1
Example:
...
  ),
  'db' =>
  array (
    'table_prefix' => '',
    'connection' =>
    array (
      'default' =>
      array (
        'host' => 'localhost',
        ...
        'profiler' => '1',
      ),
    ),
  ),
  'resource' =>
  array (
...
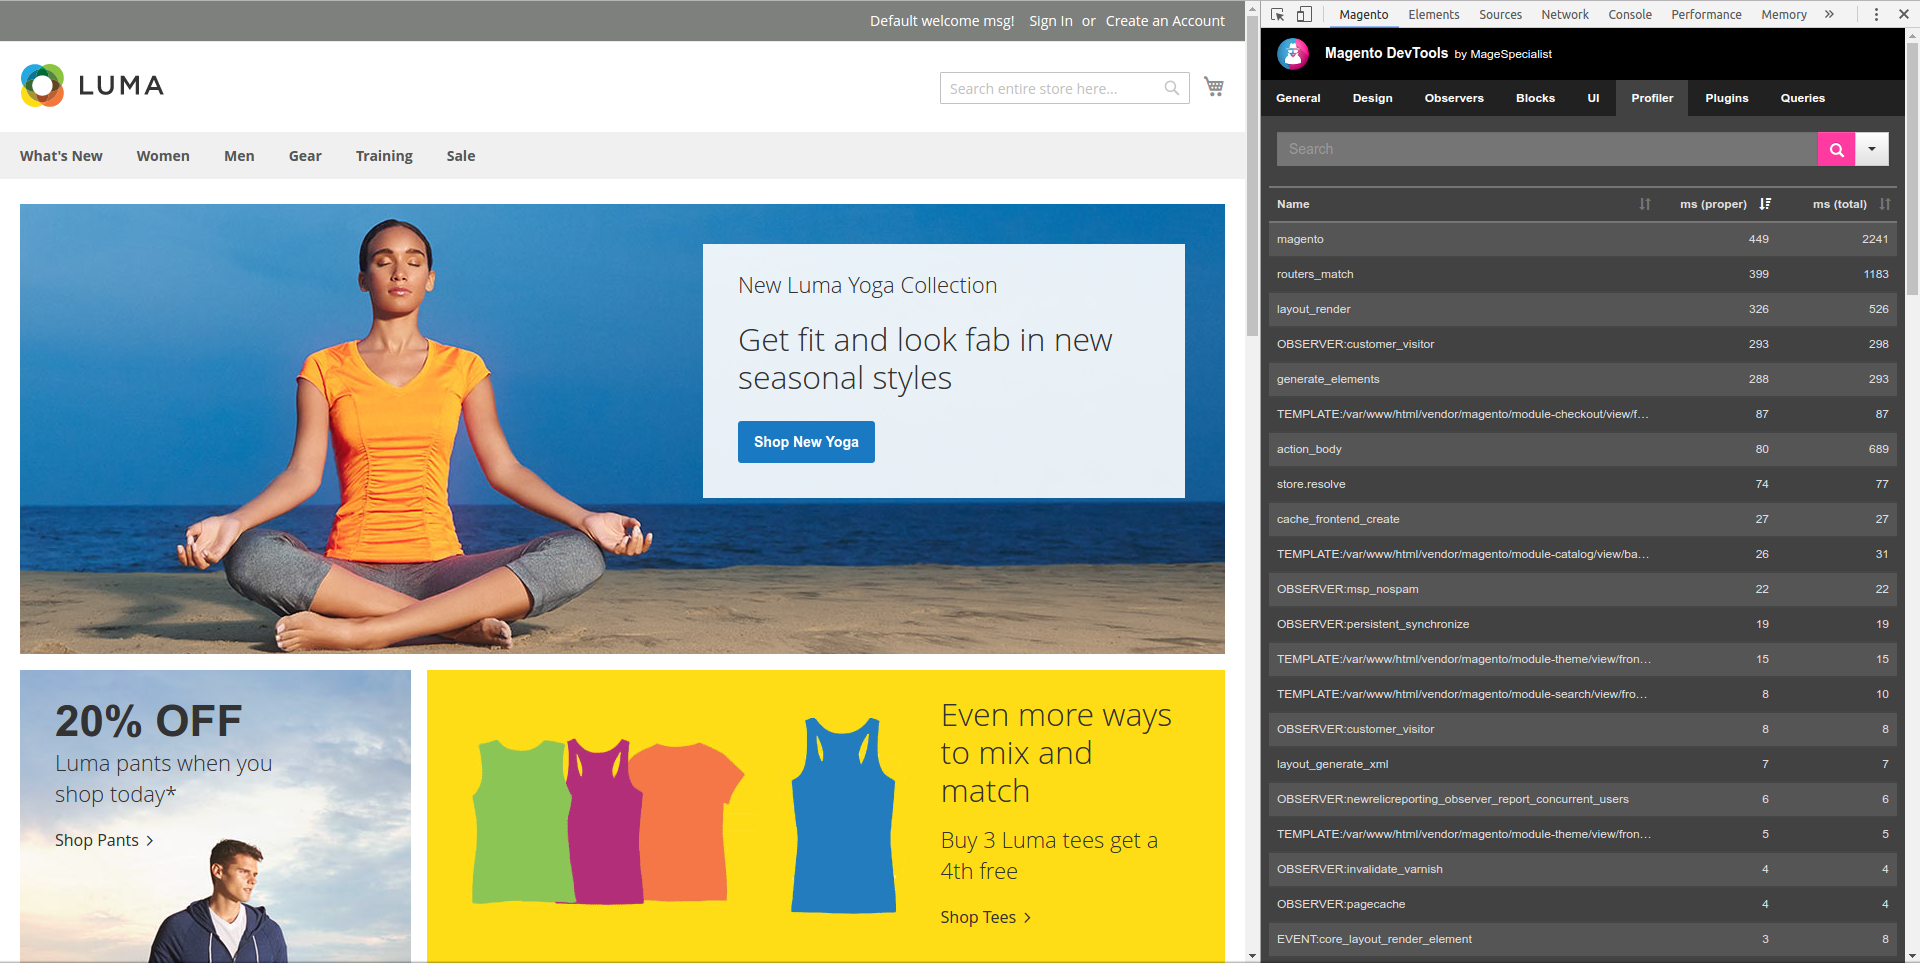
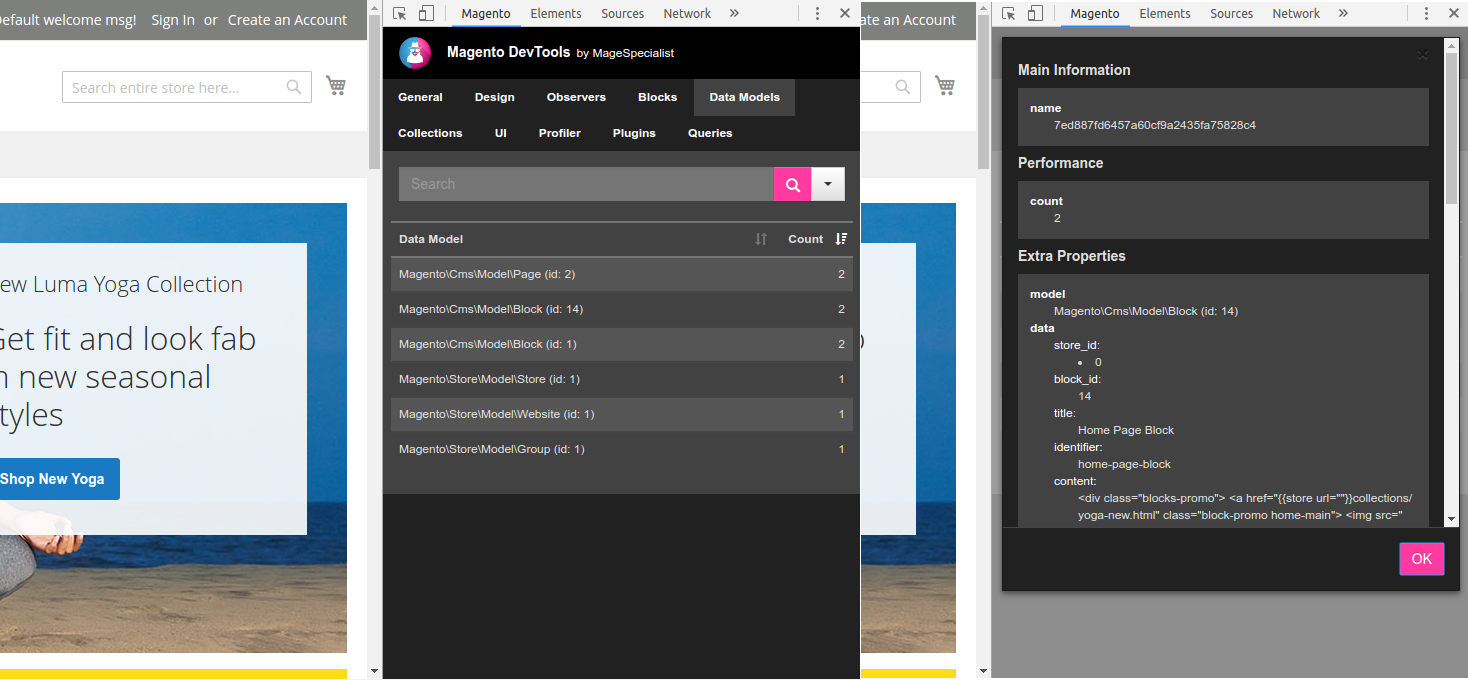
How does it work?
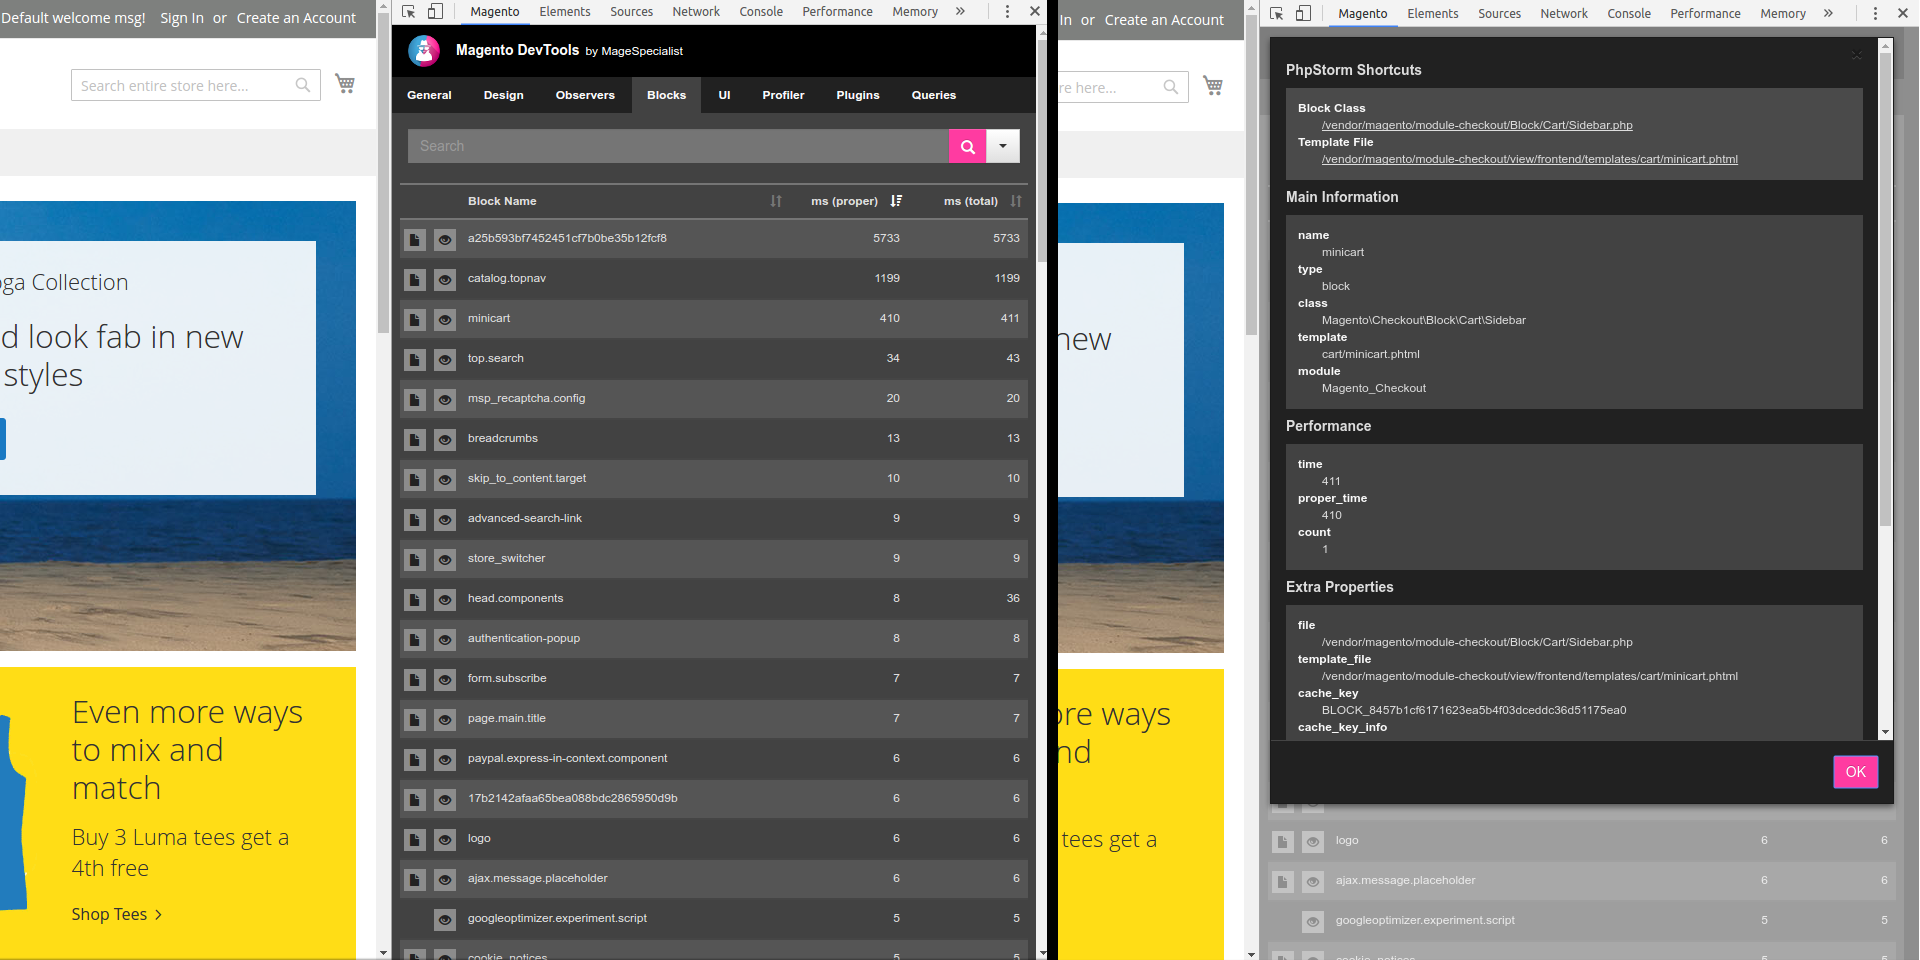
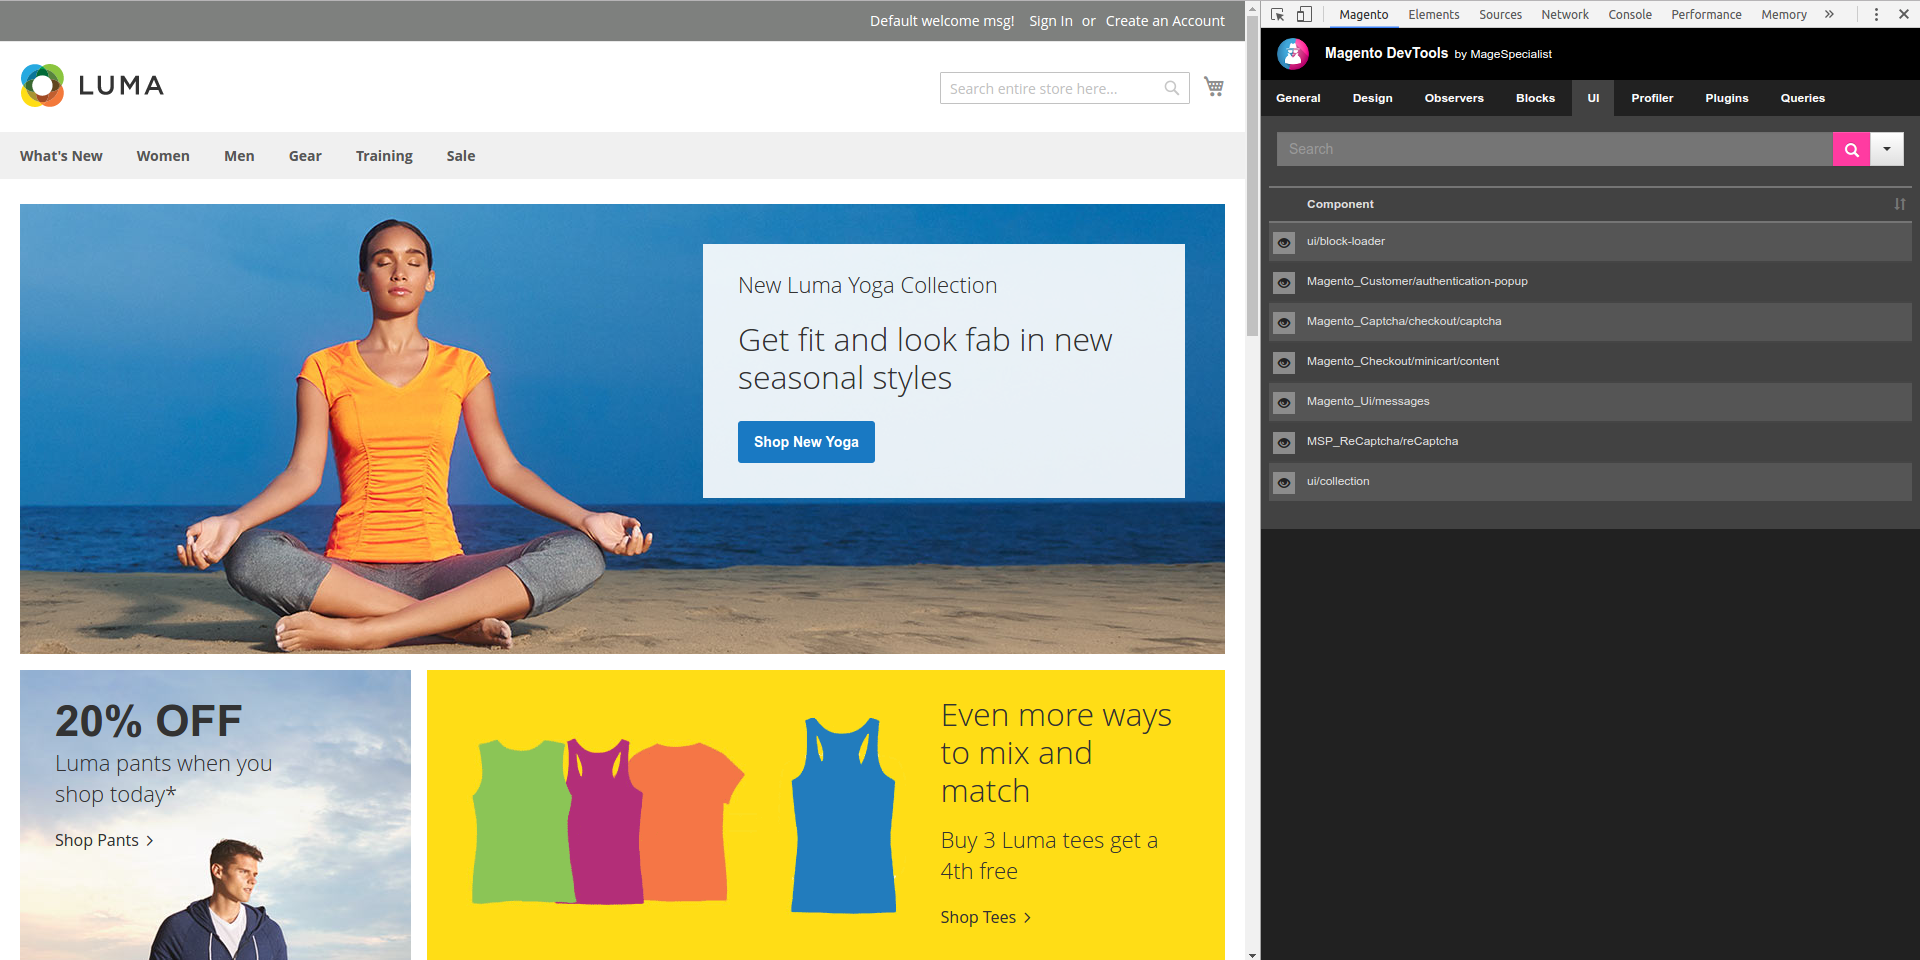
You can access both Global Page Information and Item Information through Chrome Inspector.
Inspector integration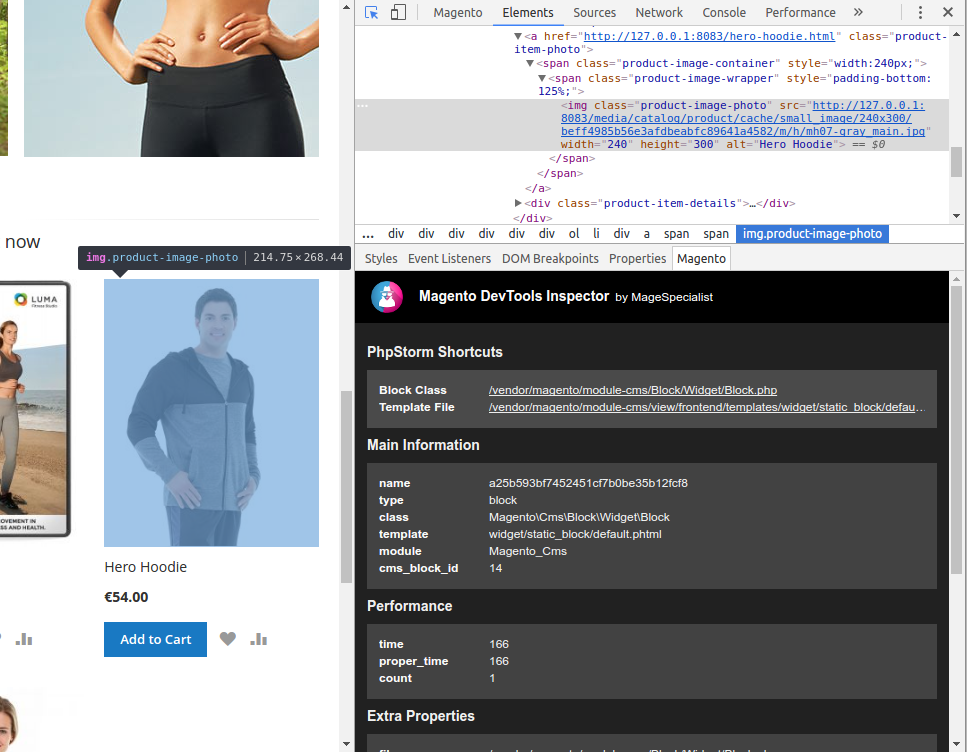
From the main panel you can see information from:
Theme Controller / Router Request parameters Layout and Layout updates Observers Data Models inspector Collections inspector Blocks, Containers, uiComponents Profiler Theme, Controller and Global information: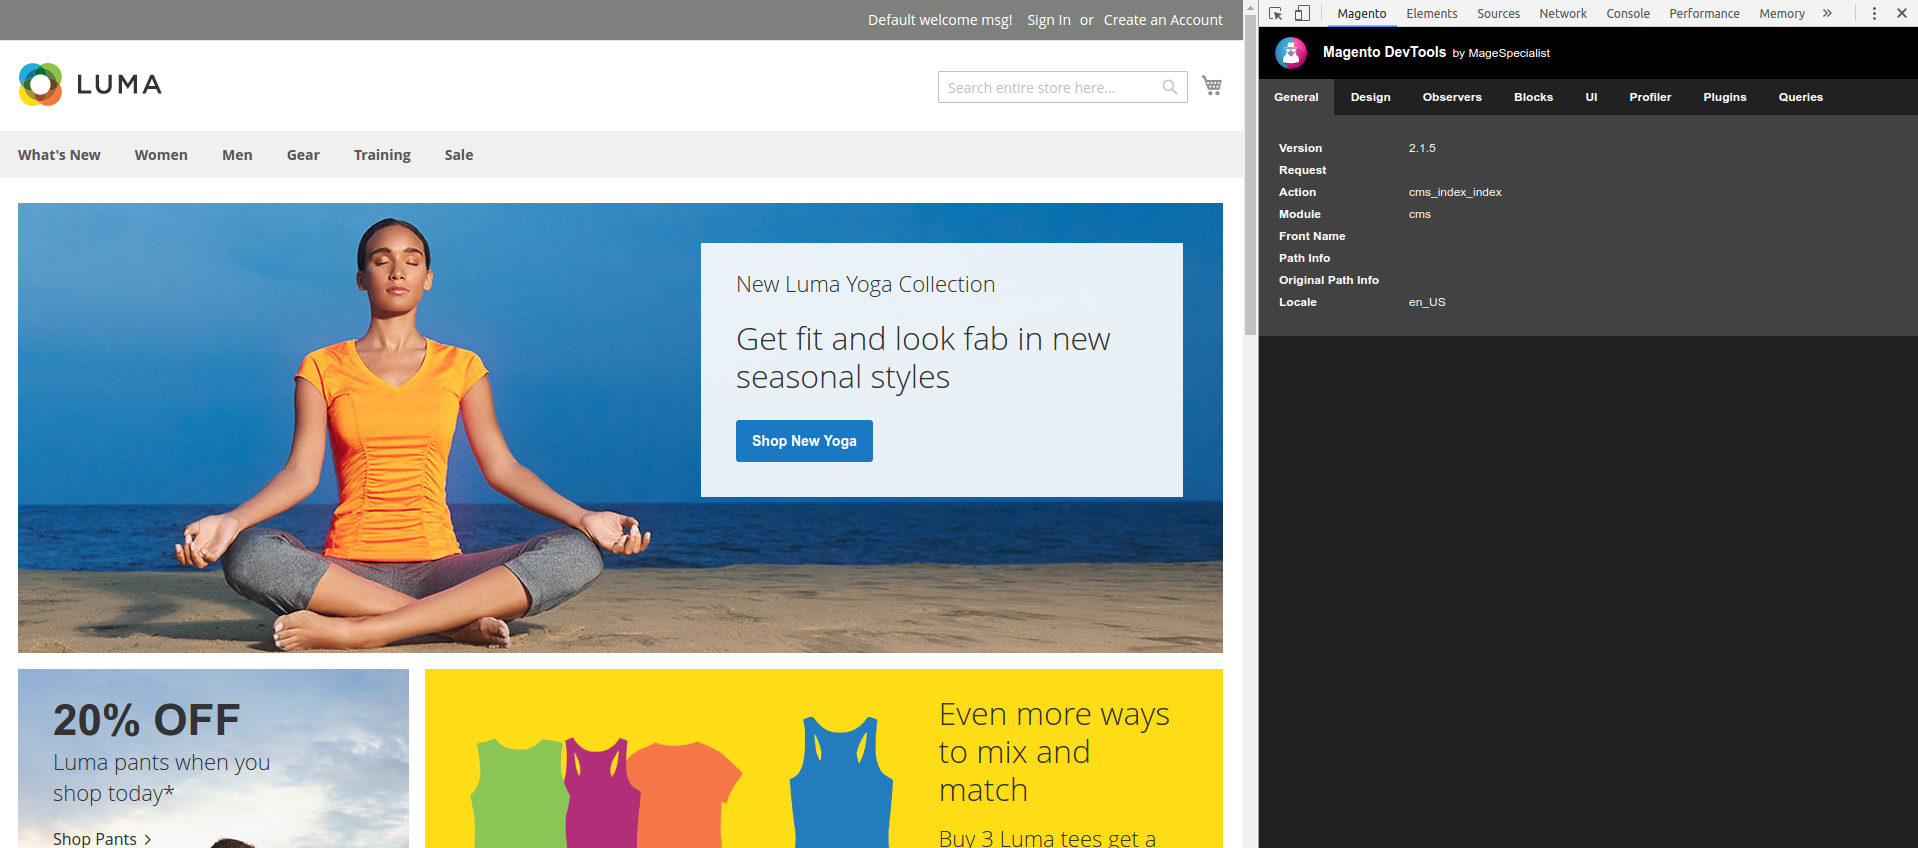

Magento Chrome Toolbar is integrated with Chrome Inspector.
By selecting an item in you page you can see:
Block information Used template Server elapsed time Block nesting Template file Cache information uiComponent information Container information PhpStorm IntegrationMagento Chrome Toolbar can be integrated with PhpStorm to directly open the template file you wish to edit.
You need to install Remote Call Plugin in PhpStorm, then enable the feature from Magento Admin.
版权声明:
1、该文章(资料)来源于互联网公开信息,我方只是对该内容做点评,所分享的下载地址为原作者公开地址。2、网站不提供资料下载,如需下载请到原作者页面进行下载。