晴读(7)——Origin软件新手入门指南
一、简介
Origin是一款功能强大的数据分析软件,广泛应用于科学研究和工程领域。它集成了数据导入、图形绘制、统计分析、数据处理等功能,可以帮助用户快速完成数据分析任务。
二、安装与启动
1. 安装:
(1)下载Origin安装包,解压后运行安装程序。
(2)按照提示完成安装过程。
2. 启动:
(1)双击桌面上的Origin图标,或者打开“开始”菜单,找到Origin程序并点击运行。
(2)打开Origin后,会自动创建一个空白文档。
三、界面介绍
1. 菜单栏:包含文件、编辑、视图、插入、格式、工具、窗口和帮助等菜单项。
2. 工具栏:提供常用功能的快捷按钮。
3. 工作区:包括数据表、图形窗口、图表、工具箱等。
4. 数据表:用于输入、编辑和查看数据。
5. 图形窗口:用于绘制和编辑图形。
6. 图表:用于显示数据统计结果。
7. 工具箱:提供各种统计、分析、绘图工具。
四、基本操作
1. 数据导入:
(1)点击“文件”菜单,选择“导入数据”或“导入图像”等选项。
(2)选择数据文件或图像文件,按照提示完成导入。
2. 绘
相关内容:
 分享兴趣,传播快乐,增长见闻,留下美好。亲爱的您,这里是LearingYard学苑!今天小编为您带来“晴读(7)——Origin软件新手入门指南欢迎您的访问!Share interest, spread happiness,increase knowledge, and leave beautiful.Dear, this is the LearingYard Academy!Today, the editor brings the"Qing Reading(7):A Beginner's Guide to Origin Software”Welcome to visit!
一、思维导图(Mind Map)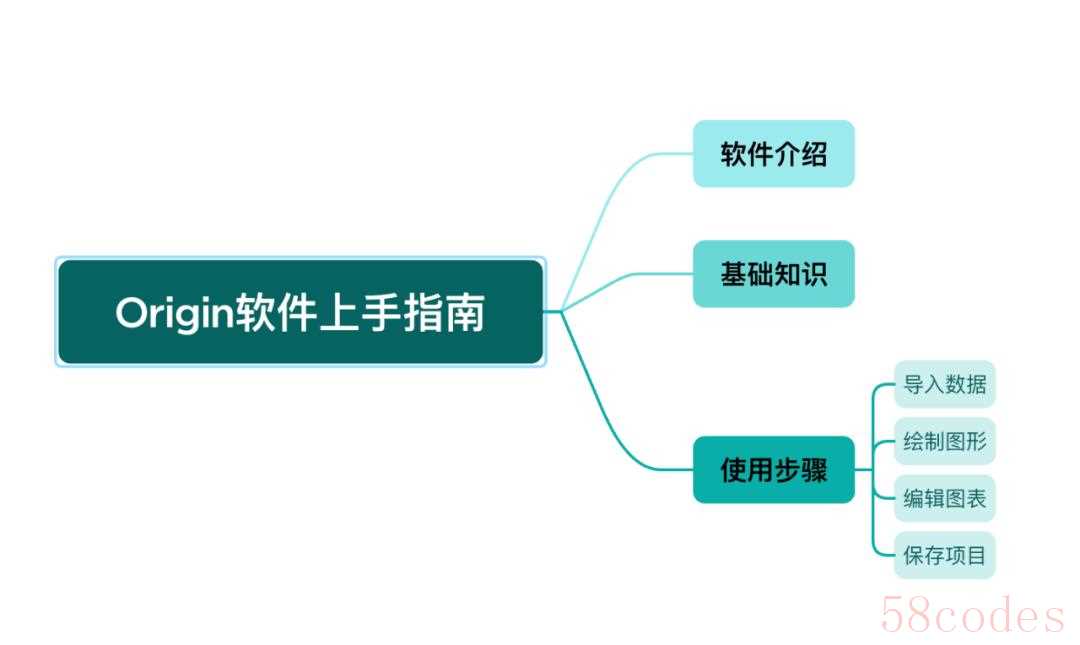
二、软件介绍(Software Introduction)Origin是一个专门用于科学绘图和数据分析的软件,特别适合处理各种实验数据和科研数据。它最早诞生于20世纪80年代末,由美国OriginLab公司开发,最初是为了帮助科研人员更方便地处理大量实验数据和画出高质量图表而设计的。经过多年的发展,Origin已经从一个简单的画图工具,变成了一个功能强大的数据分析平台。这个软件最突出的特点就是它操作简单但功能专业。你只需要把数据导入表格,就可以通过鼠标点击或简单设置来画出各种图,比如折线图、柱状图、散点图、热图、等高线图,甚至是3D图形。而且,图形的美观程度很高,很多科研论文中用到的专业图表,就是用Origin画的。除了画图,Origin还能进行各种数学、统计分析,比如曲线拟合、误差分析、回归分析、傅里叶变换等等,非常适合做科学实验的数据处理。Origin广泛应用于物理、化学、生物、材料、环境、医学、工程等科研领域,很多高校、研究机构和企业实验室都会用它来做数据可视化和分析。简单来说,如果你在做实验、写论文、做项目汇报时需要清晰、准确又美观的数据图,Origin就是一个非常好用的工具。Origin is a specialized software for scientific graphing and data analysis, particularly well - suited for handling various experimental and research data. It first emerged in the late 1980s and so which was developed by OriginLab Corporation in the United States. Initially, it was designed to assist researchers in more conveniently processing large amounts of experimental data and creating high - quality charts. Over the years, Origin has evolved from a simple drawing tool into a powerful data analysis platform. The most prominent feature of this software is its simple operation yet professional functionality. You just need to import data into the table, and then you can create various graphs through mouse clicks or simple settings, such as line charts, bar charts, scatter plots, heat maps, contour maps, and even 3D graphics. Moreover, the graphics are highly aesthetically pleasing, and many professional charts used in scientific research papers are being created with Origin. In addition to graphing, Origin can also perform various mathematical and statistical analyses, such as curve fitting, error analysis, regression analysis, Fourier transform, etc., which is very suitable for data processing in scientific experiments. Origin is widely used in scientific research fields such as physics, chemistry, biology, materials, environment, medicine, and engineering. Many universities, research institutions, and enterprise laboratories use it for data visualization and analysis. Simply put, if you need clear, and that accurate, and beautiful data graphs for experiments, thesis writing, or project reports, Origin is a very useful tool.
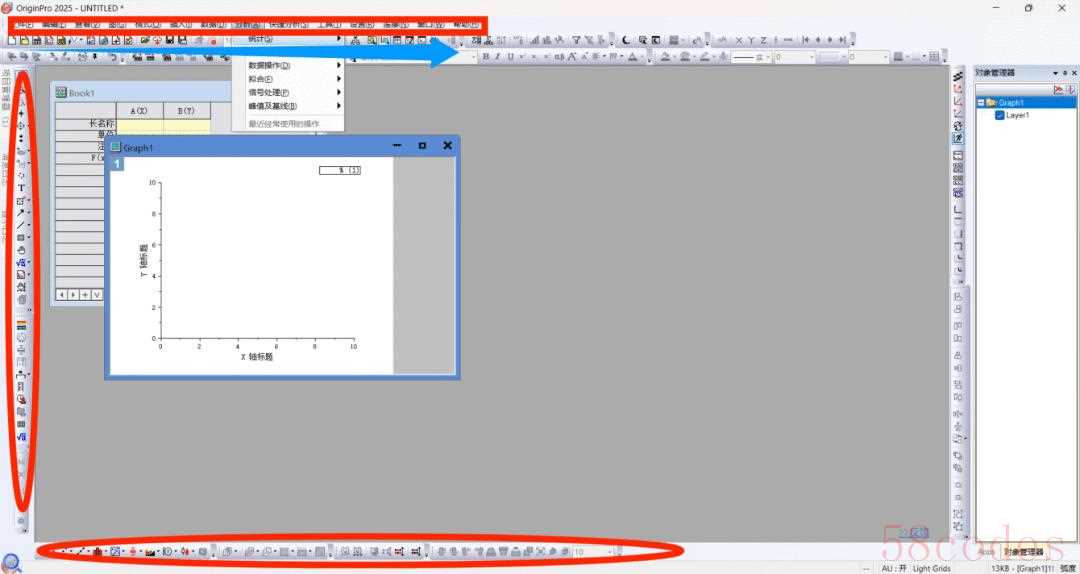
三、基础知识(Basic Knowledge)打开Origin软件可以看见界面的最上方,是软件的菜单栏,这个区域包含了“分析”“文件”“编辑”“数据”等功能。紧挨着菜单栏下方的区域则是软件的工具栏,在此处放置的是一些快捷功能,例如“新建”“导入数据”“保存”“绘图”等。在整个界面的左侧区域是项目管理器,主要用于打开所有的数据和图表,以及使用一些标识完善图表等。最下方即可以选择需要的不同图形。Opening Origin, you'll see the menu bar at the top of the interface, featuring functions like "Analysis", "File", "Edit" and "Data". Just below it is the toolbar with shortcuts such as "New", "Import Data", "Save" and "Plot". On the left is the Project Explorer, mainly for accessing all data and graphs, and adding labels to refine them. At the bottom, you can select different graphs.
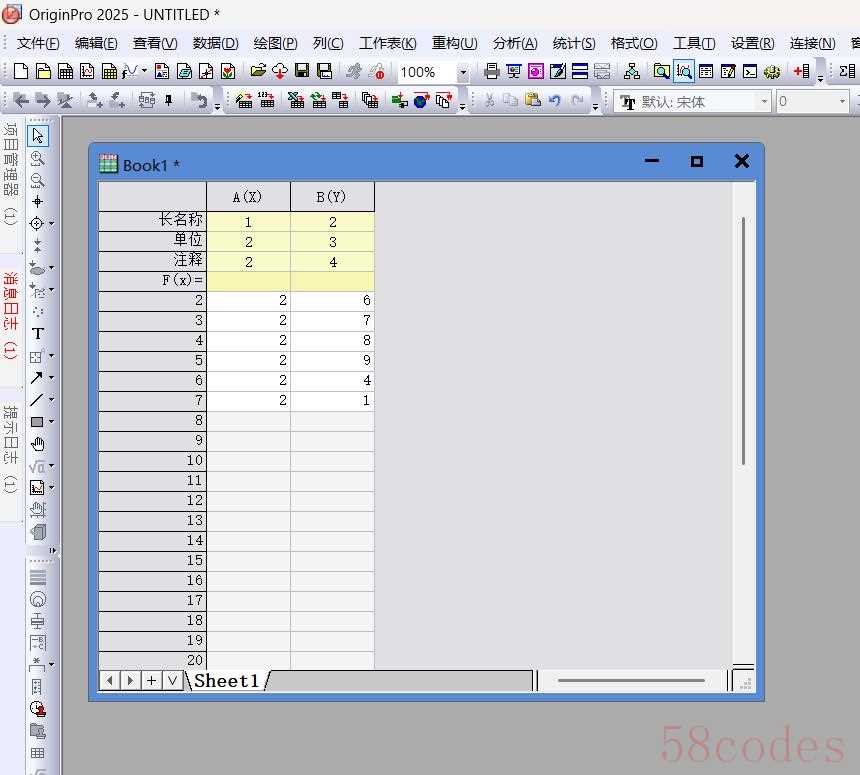
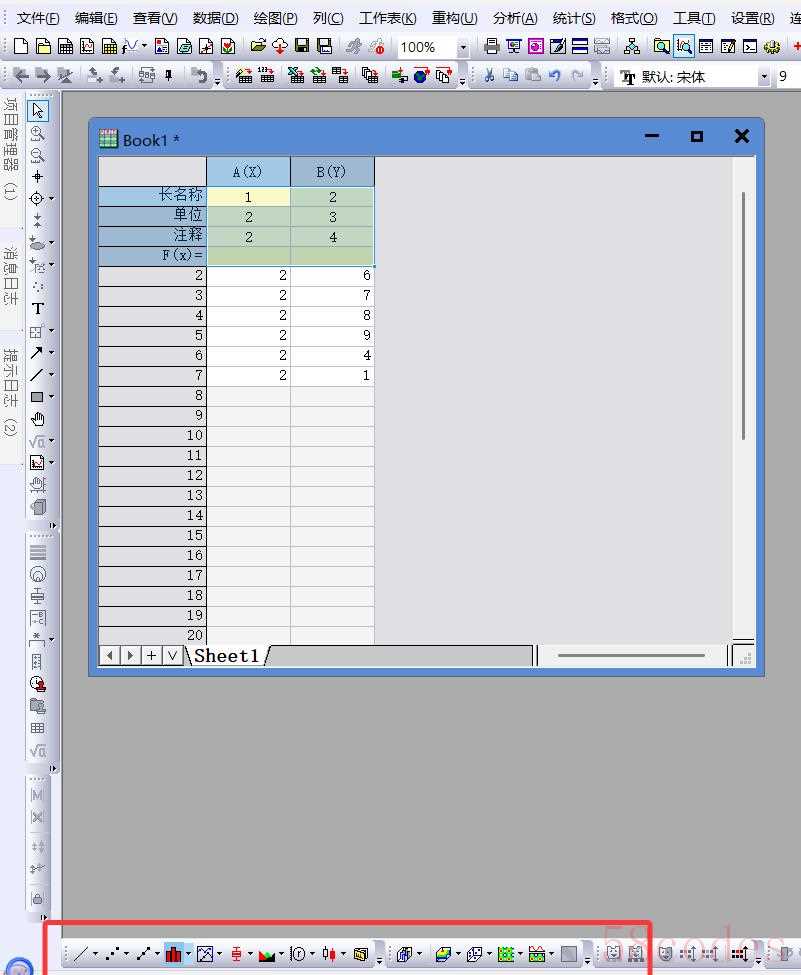
四、使用步骤(Steps for Use)1.导入数据。将准备好的数据通过直接导入文件或复制数据的方式导入进Origin的工作簿中。(通常X轴的数据在第一列,Y轴的数据在后面)Data Import: Firstly,Import your prepared data and into Origin's workbook either by directly importing a file or copying and pasting. (Typically, x-axis data is placed in the first column, followed by y-axis data in subsequent columns.
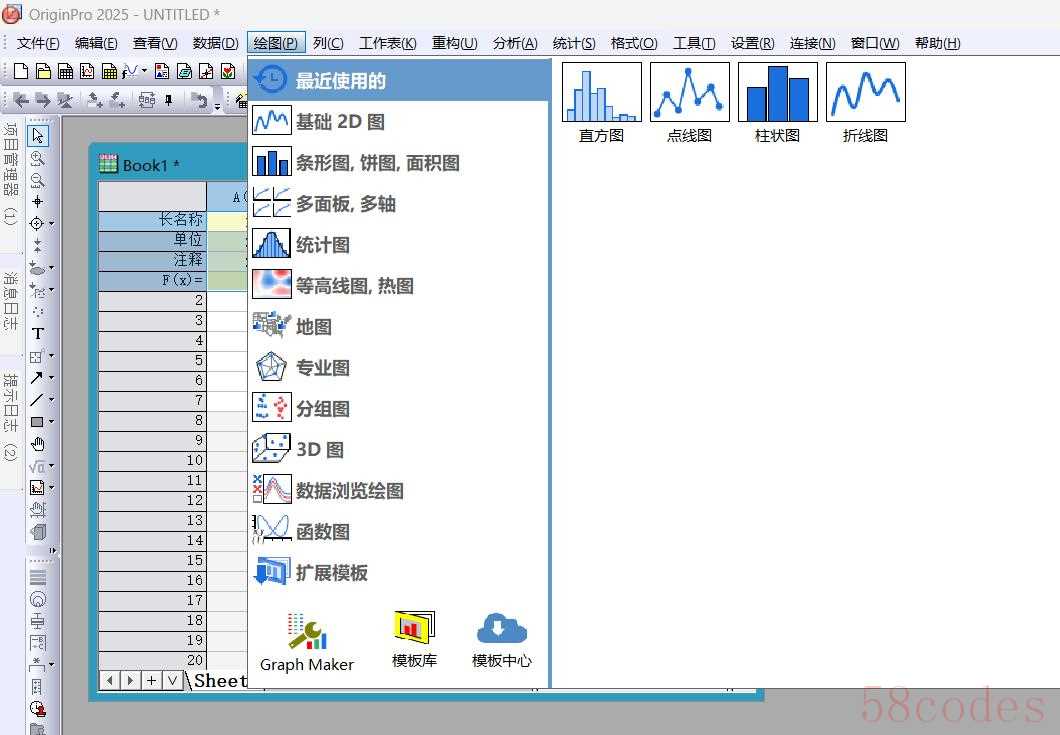
2.绘制图形。选中所需要制作图形的数据列,点击下方需要的图表类型,或者在菜单栏“绘图”中挑选想要的类型,软件就会自动生成一个窗口并展示绘制的图形。Create Graphs: Select the data columns you want to visualize, then click on the desired chart type at the bottom or choose from the "Plot" menu in the toolbar. Origin will automatically generate a window displaying your graph.
 3.编辑图表。双击图中的轴、图例、标题等可以根据自己的需求更改美化字体、颜色线条粗细等。 Edit Charts: Double-click on axes, legends, titles, etc., in the graph to modify and enhance them as needed—such as adjusting fonts, colors, and line thickness.
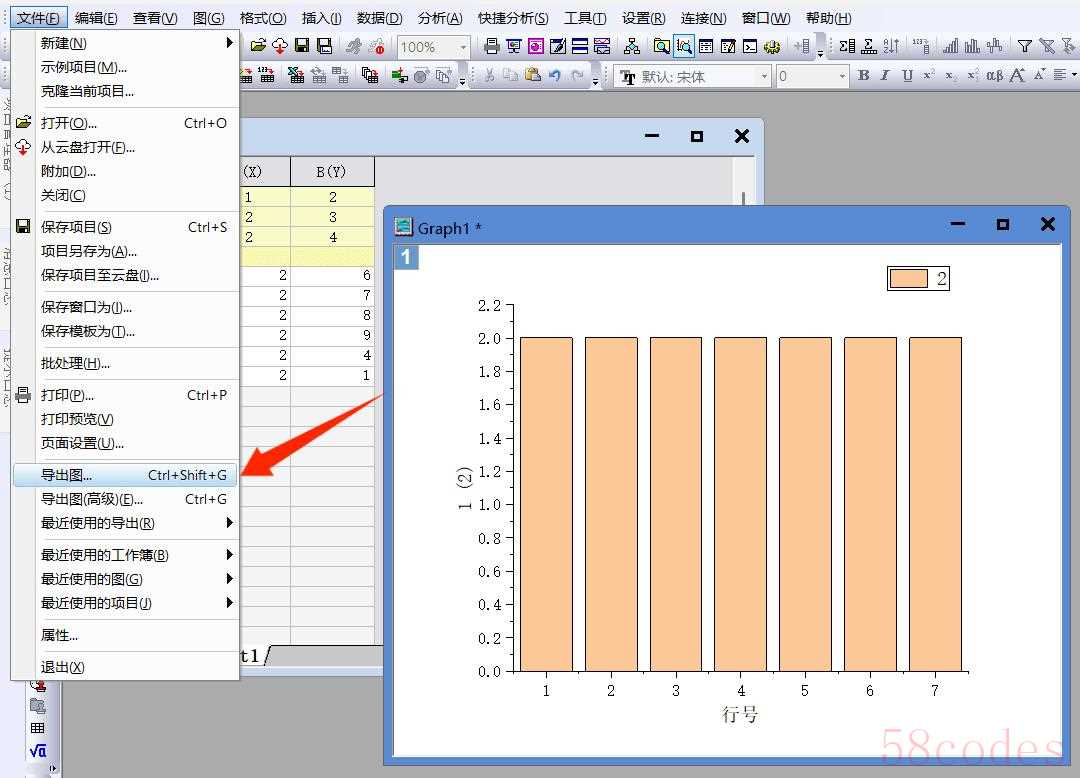
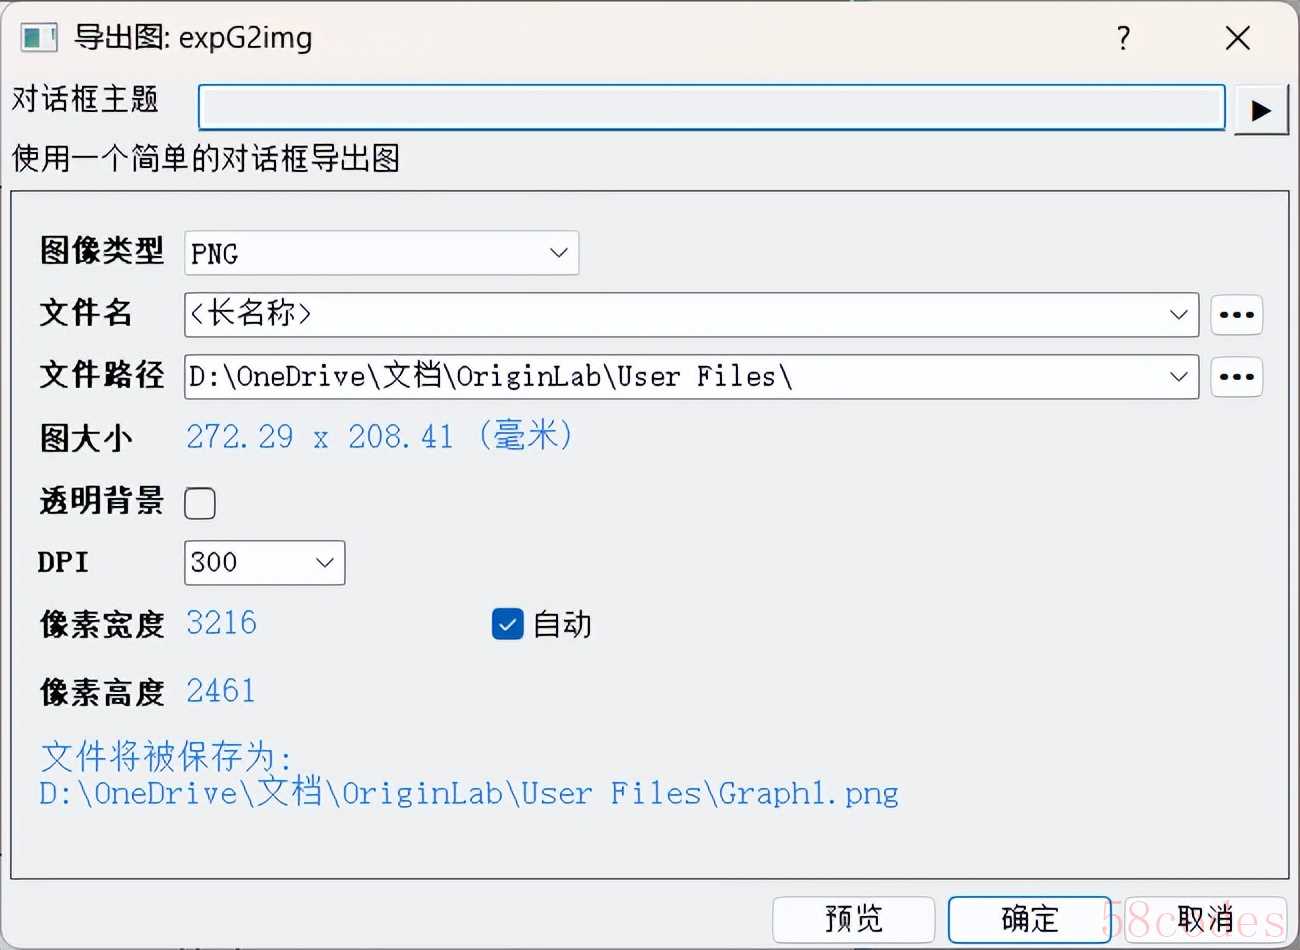
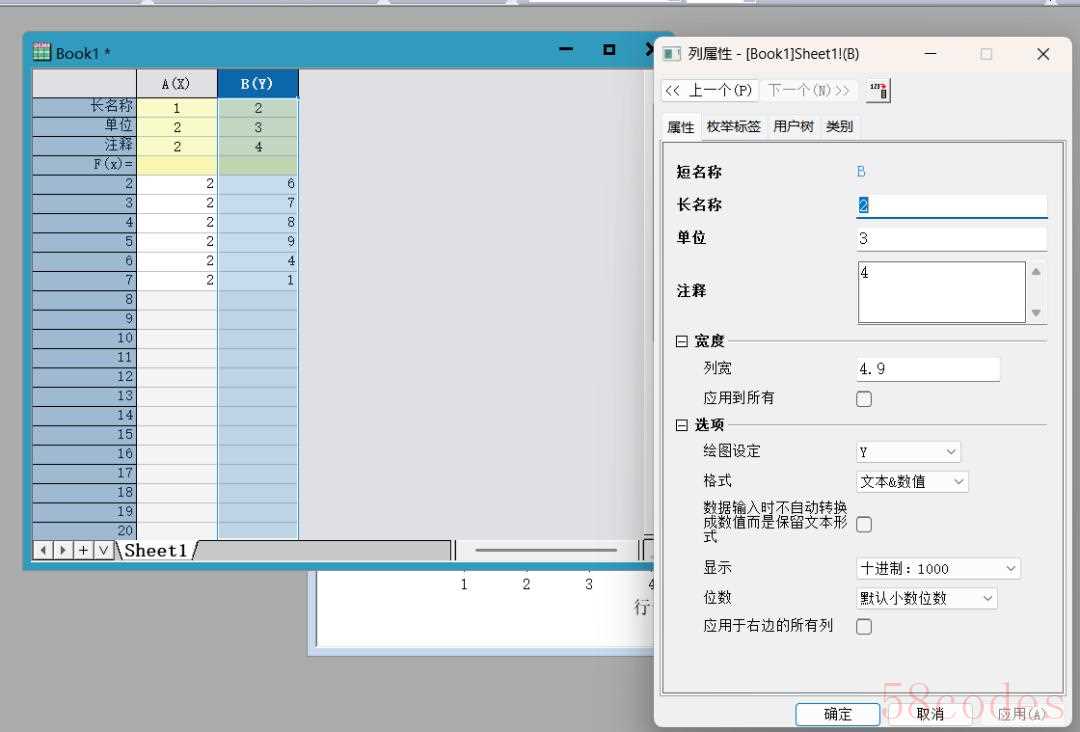 4.保存项目。点击左上角的“保存”将文件保存为.opju的格式,可以便于下一次使用打开文件,继续编辑。若需要导出做好的图表,可以点击图表的窗口,再点击菜单栏的文件,选择“导出图形”,选择需要的格式。Save Project: Click "Save" in the top-left corner to save the file in .opju format, making it easy to open and continue editing next time. To export the completed chart, click on the chart window, then go to "File" in the menu bar, select "Export Graph", and we choose the desired format.
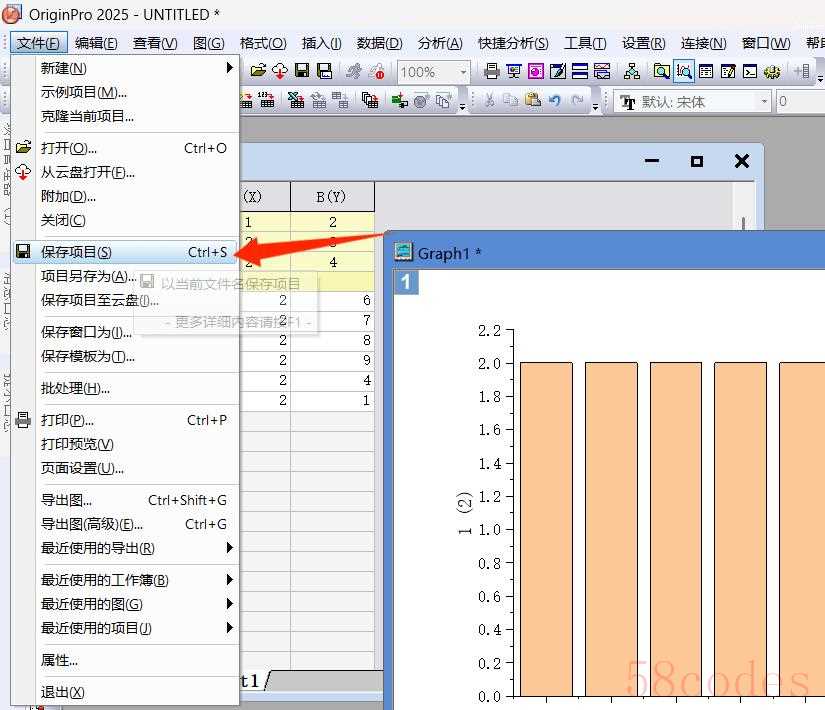
 微信扫一扫打赏
 支付宝扫一扫打赏